Stocks: Sectors
- Energy
- Materials
- Industrials
- Consumer Discretionary
- Consumer Staples
- Health Care
- Financial
- Technology
- Utilities
Futures
Benchmarks
Forex
Industries
Comparative
Seasonal Start
Economic Data
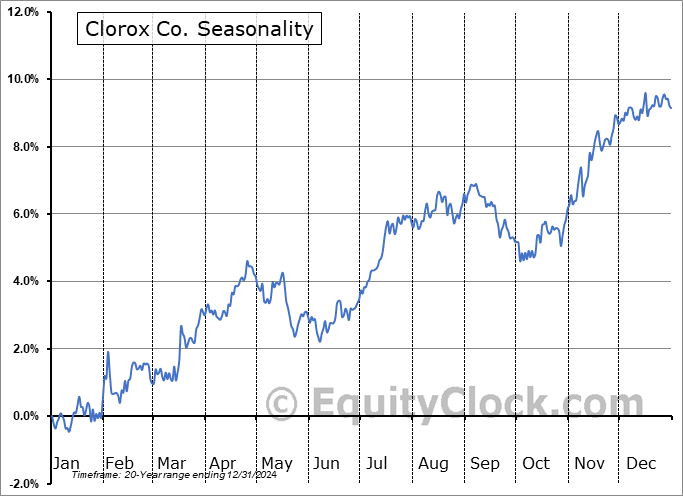
Clorox Co. (NYSE:CLX) Seasonal Chart
Seasonal Chart Analysis
Analysis of the Clorox Co. (NYSE:CLX) seasonal charts above shows that a Buy Date of November 4 and a Sell Date of March 28 has resulted in a geometric average return of 0.9% above the benchmark rate of the S&P 500 Total Return Index over the past 20 years. This seasonal timeframe has shown positive results compared to the benchmark in 13 of those periods. This is a good rate of success and the return strongly outperforms the relative buy-and-hold performance of the stock over the past 20 years by an average of 5.35% per year.
The seasonal timeframe correlates Poorly with the period of seasonal strength for the Consumer Staples sector, which runs from April 25 to November 23. The seasonal chart for the broad sector is available via the following link: Consumer Staples Sector Seasonal Chart.
The Clorox Co. engages in the manufacture and marketing of consumer and professional products. It operates through the following business segments: Health and Wellness, Household, Lifestyle, and International. The Health and Wellness segment consists of cleaning products, professional products and vitamins, minerals and supplements mainly marketed and sold in the United States. The Household segments consists of bags and wraps, grilling products and cat litter marketed and sold in the United States. The Lifestyle segment refers to food, natural personal care products and water-filtration products marketed and sold in the United States. The International segment covers products sold outside the United States, excluding natural personal care products. The company was founded by Edward Hughes, Charles Husband, William Hussey, Rufus Myers, and Archibald Taft on May 3, 1913 and is headquartered in Oakland, CA.
 To download CLX seasonal chart data, please log in or Subscribe.
Stocks mentioned in this post: CLX
Symbols by Letter: A | B | C | D | E | F | G | H | I | J | K | L | M | N | O | P | Q | R | S | T | U | V | W | X | Y | Z
|
|


