Stocks: Sectors
- Energy
- Materials
- Industrials
- Consumer Discretionary
- Consumer Staples
- Health Care
- Financial
- Technology
- Utilities
Futures
Benchmarks
Forex
Industries
Comparative
Seasonal Start
Economic Data
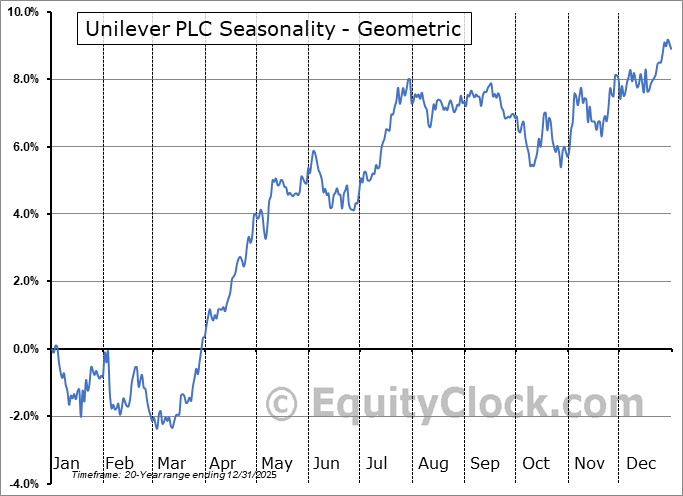
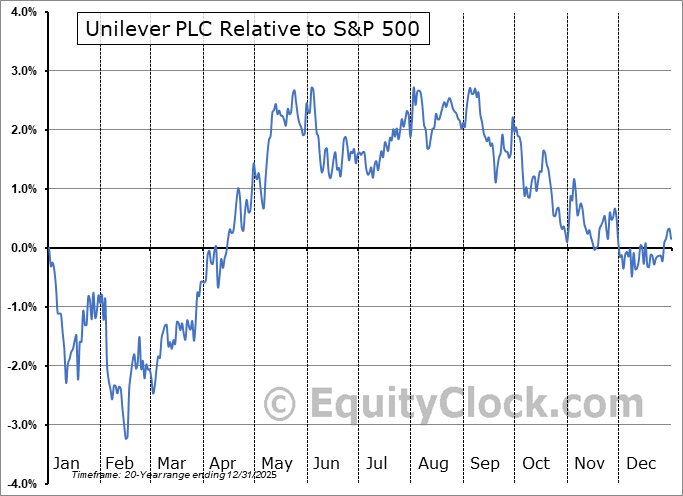
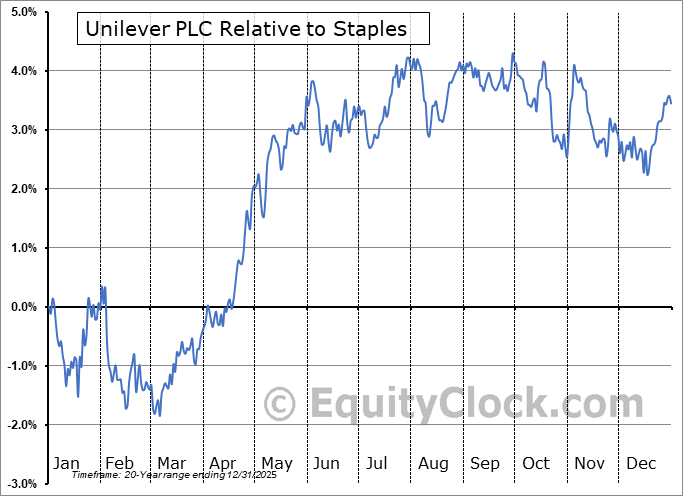
Unilever PLC (NYSE:UL) Seasonal Chart
Seasonal Chart Analysis
Analysis of the Unilever PLC (NYSE:UL) seasonal charts above shows that a Buy Date of February 15 and a Sell Date of May 15 has resulted in a geometric average return of 4.89% above the benchmark rate of the S&P 500 Total Return Index over the past 20 years. This seasonal timeframe has shown positive results compared to the benchmark in 17 of those periods. This is a very good rate of success and the return strongly outperforms the relative buy-and-hold performance of the stock over the past 20 years by an average of 6.66% per year.
The seasonal timeframe correlates Poorly with the period of seasonal strength for the Consumer Staples sector, which runs from April 25 to November 23. The seasonal chart for the broad sector is available via the following link: Consumer Staples Sector Seasonal Chart.
Unilever Plc engages in the manufacture and sale of consumer goods. It operates through the following segments: Beauty & Wellbeing, Personal Care, Home Care, Nutrition, and Ice Cream. The Beauty & Wellbeing segment offers hair care, skin care, and prestige beauty and health & wellbeing. The Personal Care segment consists of sales of skin cleansing, deodorant, and oral care products. The Home Care segment comprises of sales of fabric care and a wide range of cleaning products. The Nutrition segment refers to sales of scratch cooking aids, dressings, and tea products. The Ice Cream segment covers primarily ice cream products. The company was founded by Antonius Johannes Jurgens, Samuel van den Bergh, and William Hulme Lever in 1930 and is headquartered in London, the United Kingdom.
 To download UL seasonal chart data, please log in or Subscribe.
Stocks mentioned in this post: UL
Symbols by Letter: A | B | C | D | E | F | G | H | I | J | K | L | M | N | O | P | Q | R | S | T | U | V | W | X | Y | Z
|
|


