Benchmarks with a core-cyclical influence continue to chart threatening technical setups as investors rotate to defensive alternatives.
*** Stocks highlighted are for information purposes only and should not be considered as advice to purchase or to sell mentioned securities. As always, the use of technical and fundamental analysis is encouraged in order to fine tune entry and exit points to average seasonal trends.
Stocks Entering Period of Seasonal Strength Today:
Subscribers – Click on the relevant link to view the full profile. Not a subscriber? Signup here.


Super Simple Seasonal Portfolio
This content is exclusive to subscribers of EquityClock.com. Please Log In or Subscribe to proceed.
The Markets
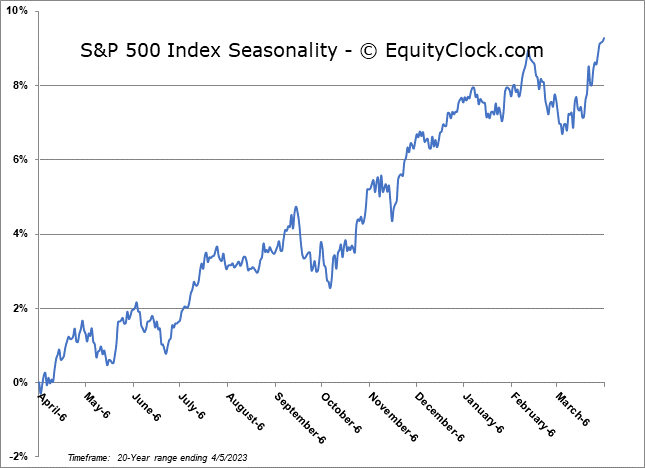
Stocks slipped for a second day as the rotation away from core-cyclical sectors and into defensive areas of the market continues. The S&P 500 Index closed with a loss of a quarter of one percent, showing ongoing reaction to the range of resistance between 4100 and 4200. What was resistance through the middle of March at the confluence of major moving averages in the range of 3900 to 4000 can be viewed as near-term support, reaction to which will be heavily scrutinized to discern whether March’s breakdown below this span amidst the banking crisis was just a fluke or whether it was just the first crack in the technicals that could lead to a break below the December lows as we head towards the off-season for stocks in a few week’s time. A move below the December low at 3764 is still required to suggest negative intermediate-term implications, one where a trend of lower-lows and lower-highs would once again threaten the lows charted in October. Until then, the market appears comfortable with the benchmark in this broader span between 3800 to 4200, even though the gyrations below the surface are becoming increasingly significant and indicative of investors anticipating a downfall of prices at the aggregate level ahead.

This content is exclusive to subscribers of EquityClock.com. Please Log In or Subscribe to proceed.
Seasonal charts of companies reporting earnings today:


S&P 500 Index

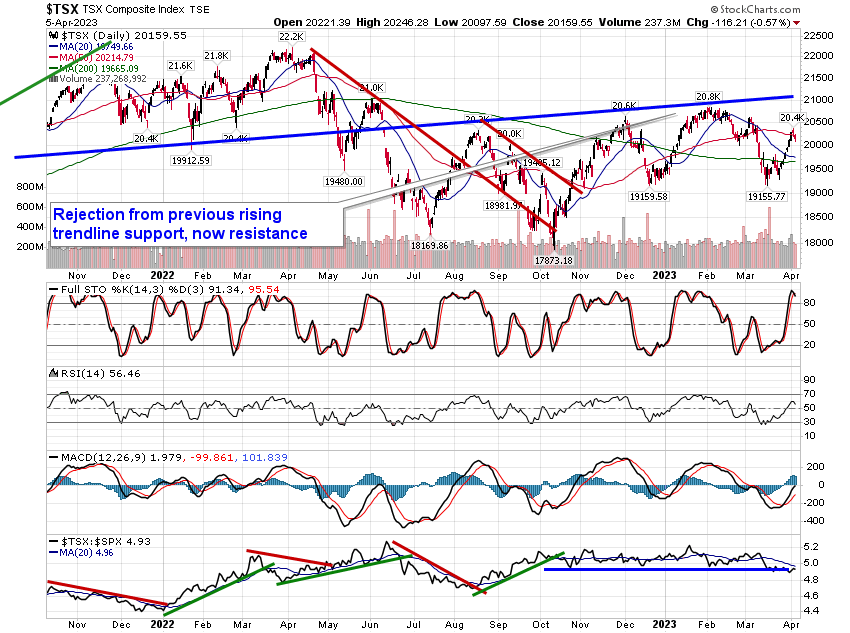
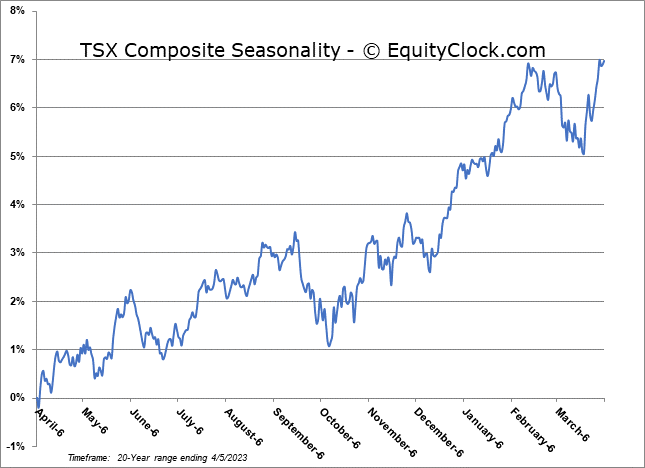
TSE Composite