April payrolls average an increase of 0.7% (NSA), which, if realized, would equate to the actual addition of 1.082 million jobs.
*** Stocks highlighted are for information purposes only and should not be considered as advice to purchase or to sell mentioned securities. As always, the use of technical and fundamental analysis is encouraged in order to fine tune entry and exit points to average seasonal trends.
Stocks Entering Period of Seasonal Strength Today:
Subscribers – Click on the relevant link to view the full profile. Not a subscriber? Signup here.


Super Simple Seasonal Portfolio
This content is exclusive to subscribers of EquityClock.com. Please Log In or Subscribe to proceed.
The Markets
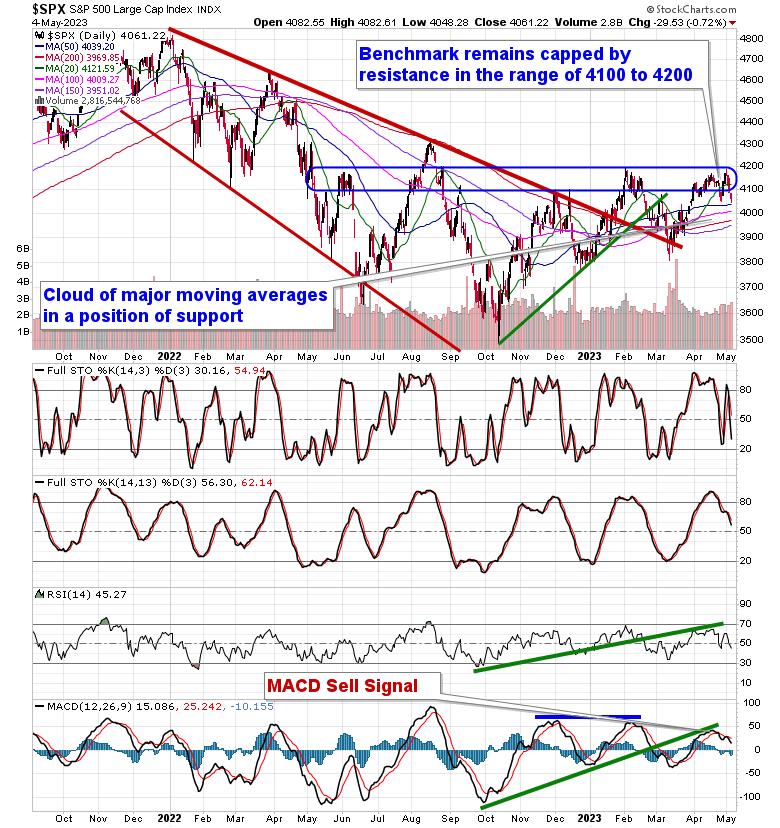
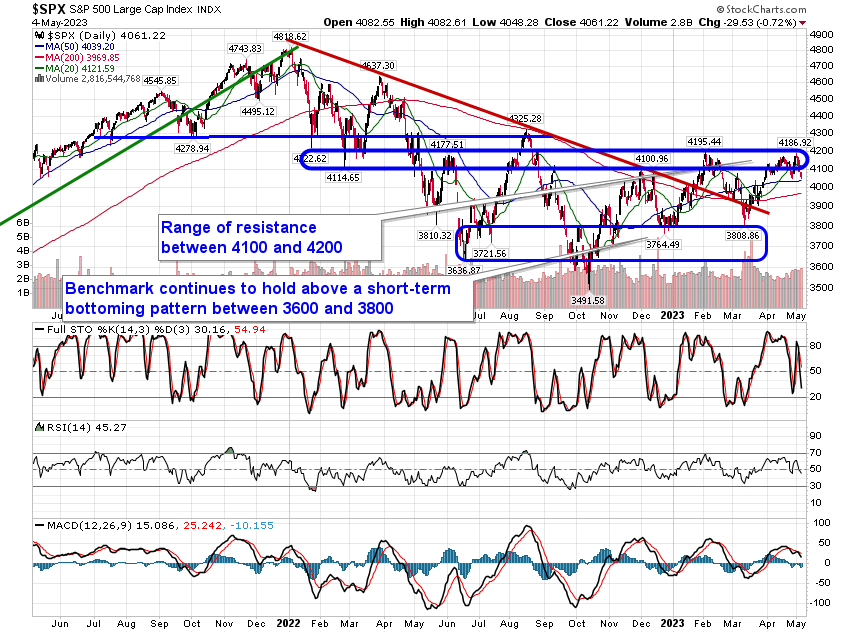
Ongoing concerns pertaining to a banking crisis continue to weigh on the broader market, sending stocks lower for a fourth straight session. The S&P 500 Index closed with a decline of just over seven-tenths of one percent, continuing to realize rejection from the range of resistance between 4100 and 4200. The barrier forms the basis of a double-top pattern, a setup that has downside implications of 400-points below the lower limit of the pattern and horizontal support at 3800. For now, the benchmark is maintaining support at the congestion of major moving averages in the range between 3950 to 4050, but confidence that it will be able to maintain this variable range is low given the significant barrier presented overhead and the ongoing degradation in momentum. We have reached the average peak to the best six month trend for stocks that started in October and equity market performance following this date is typically nothing to get excited about, nor something to be overly exposed to on the long side.
This content is exclusive to subscribers of EquityClock.com. Please Log In or Subscribe to proceed.
Seasonal charts of companies reporting earnings today:


 Seasonal Chart")


S&P 500 Index

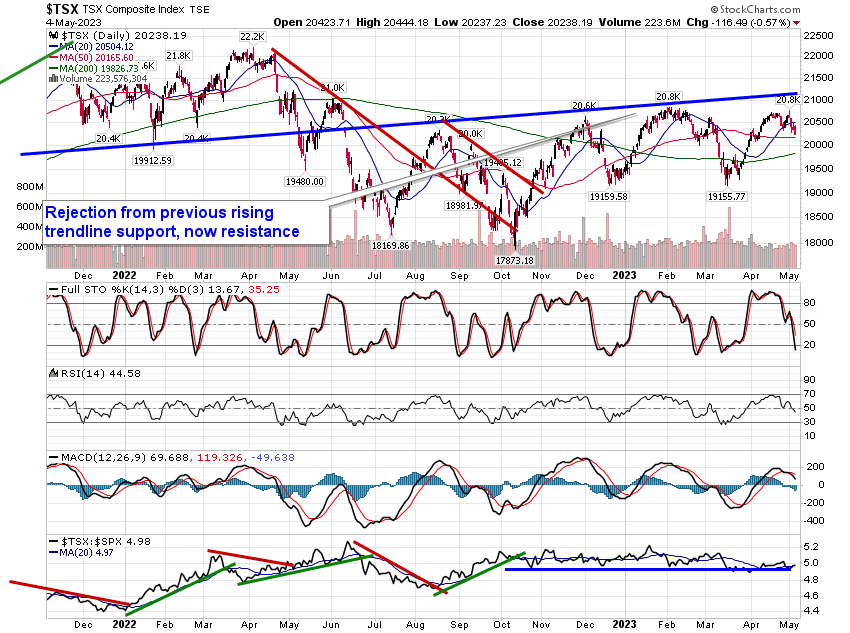
TSE Composite