Mean reversion among asset classes may provide an opportunity in two favour seasonal trades before the quarter comes to a close.
*** Stocks highlighted are for information purposes only and should not be considered as advice to purchase or to sell mentioned securities. As always, the use of technical and fundamental analysis is encouraged in order to fine tune entry and exit points to average seasonal trends.
Stocks Entering Period of Seasonal Strength Today:
Subscribers – Click on the relevant link to view the full profile. Not a subscriber? Signup here.


Super Simple Seasonal Portfolio
This content is exclusive to subscribers of EquityClock.com. Please Log In or Subscribe to proceed.
Note: Due to the US market closure on Monday as a result of the Juneteenth National Independence Day holiday, our next report will be released on Tuesday.
The Markets
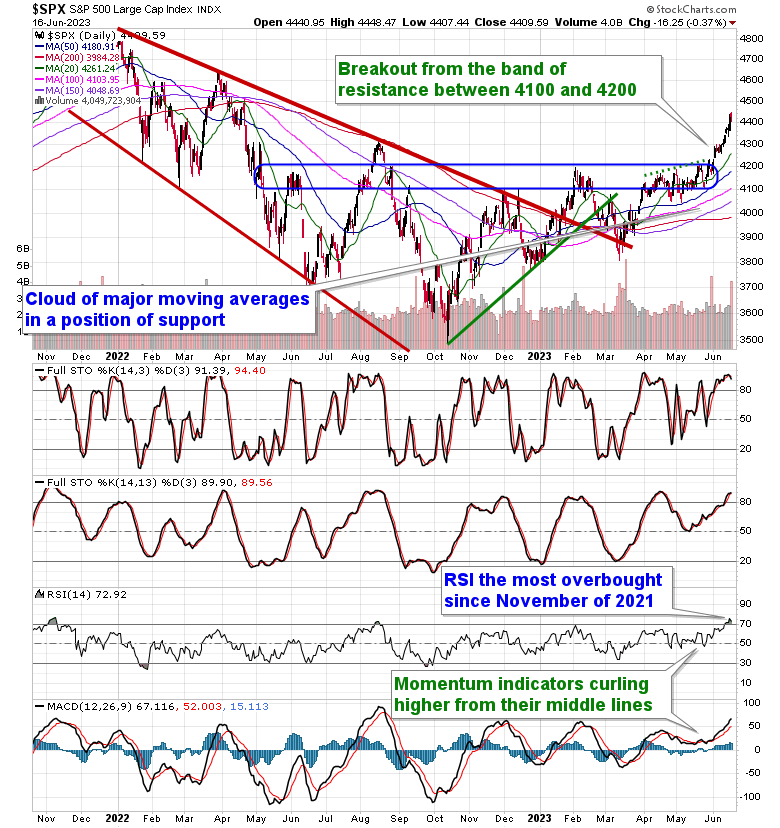
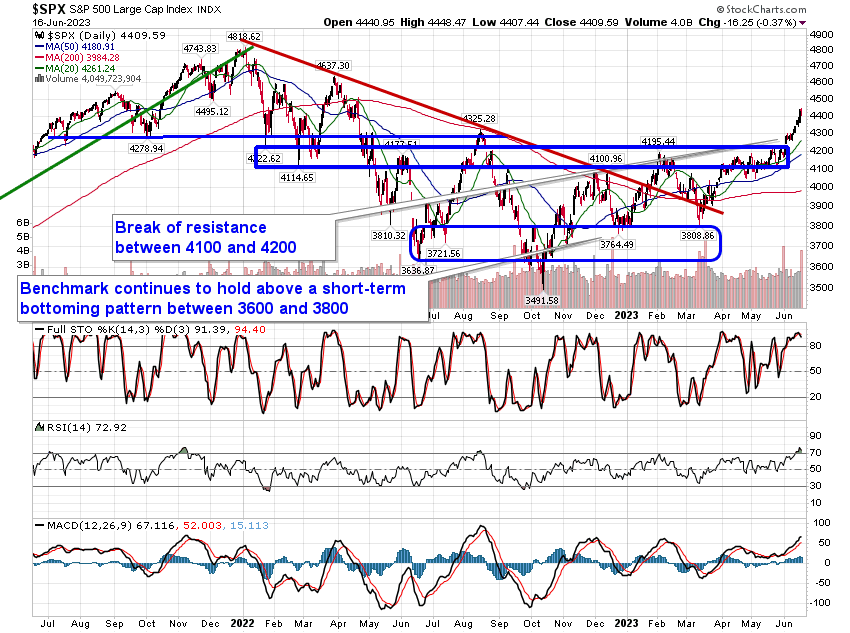
Stocks closed slightly lower on Friday following a very strong week for equity markets that saw the first meaningful expansion of breadth in months. The S&P 500 Index closed lower by just less than four-tenths of one percent, retaining the short-term parabolic pattern that was derived following the breakout above resistance at 4200. The benchmark remains the most overbought according to the Relative Strength Index (RSI) since November of 2021 and, aside from Friday’s slight reversal, significant signs of buying exhaustion have yet to materialize. Support remains firm around major moving averages with the 20-day at 4261 and the 50-day at 4181. A pullback towards these hurdles prior to the start of the average summer rally period between the end of June and the middle of July would provide the ideal setup to increase risk (equity) exposure in portfolios, but the timeframe before the end of the month/quarter/first half of the year is narrowing rapidly.
This content is exclusive to subscribers of EquityClock.com. Please Log In or Subscribe to proceed.
Seasonal charts of companies reporting earnings today:


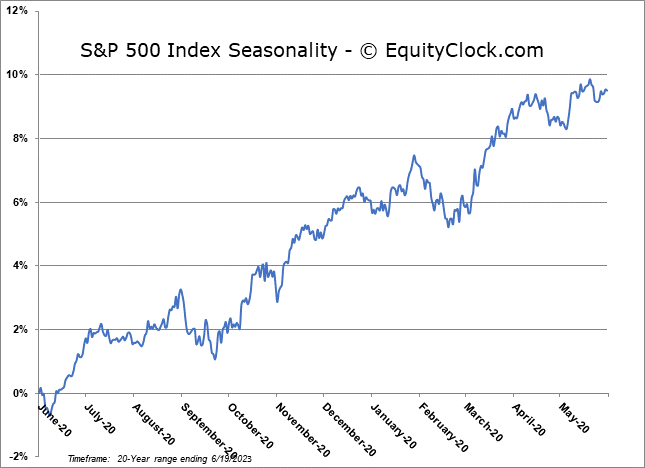
S&P 500 Index
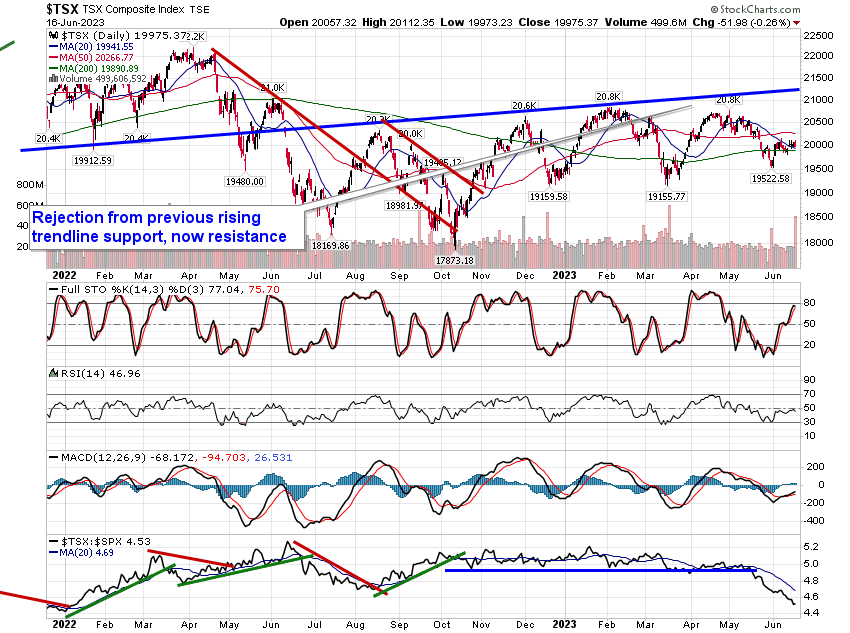
TSE Composite