Active managers reduced their exposure to stocks by the second most amount on record over a three week period.
*** Stocks highlighted are for information purposes only and should not be considered as advice to purchase or to sell mentioned securities. As always, the use of technical and fundamental analysis is encouraged in order to fine tune entry and exit points to average seasonal trends.
Stocks Entering Period of Seasonal Strength Today:
Subscribers Click on the relevant link to view the full profile. Not a subscriber? Signup here.


Super Simple Seasonal Portfolio
This content is exclusive to subscribers of EquityClock.com. Please Log In or Subscribe to proceed.
The Markets
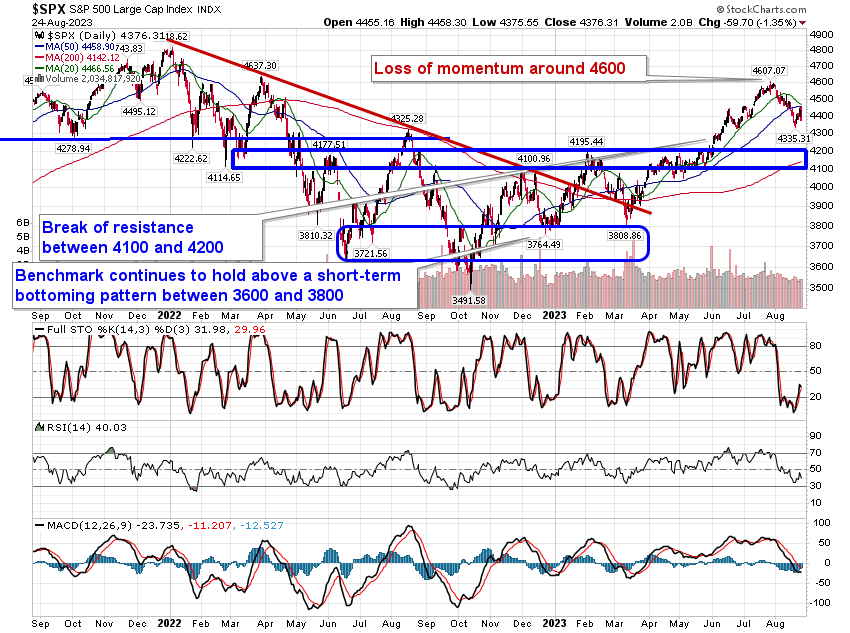
Stocks slipped on Thursday after failing to reap the benefit of the massive beat on earnings from tech titan NVIDIA (NVDA). The S&P 500 Index closed with a loss of 1.35%, charting an outside reversal candlestick from the 50-day moving average at 4459. The variable hurdle is now confirmed as a level of resistance, joining the 20-day moving average, which is already pointed lower. Struggle below the 50-day moving average has negative intermediate-term implications for the market, meaning a period of weakness spanning months rather than just weeks. Given that the market has not even reached the halfway point to this period of normal volatility/weakness, this is aligned with the seasonal view for stocks heading towards the end of the third quarter. The rebound of momentum indicators in recent days is showing signs of stalling as the bears use the perceived lack of enthusiasm from the bulls to attempt another downside push. Through the remainder of the month and into the first week of September, selling pressures tend to alleviate surrounding the Labor day holiday period, but the weakest time of the year for the market is directly ahead during the back half of September.

This content is exclusive to subscribers of EquityClock.com. Please Log In or Subscribe to proceed.
Seasonal charts of companies reporting earnings today:


S&P 500 Index

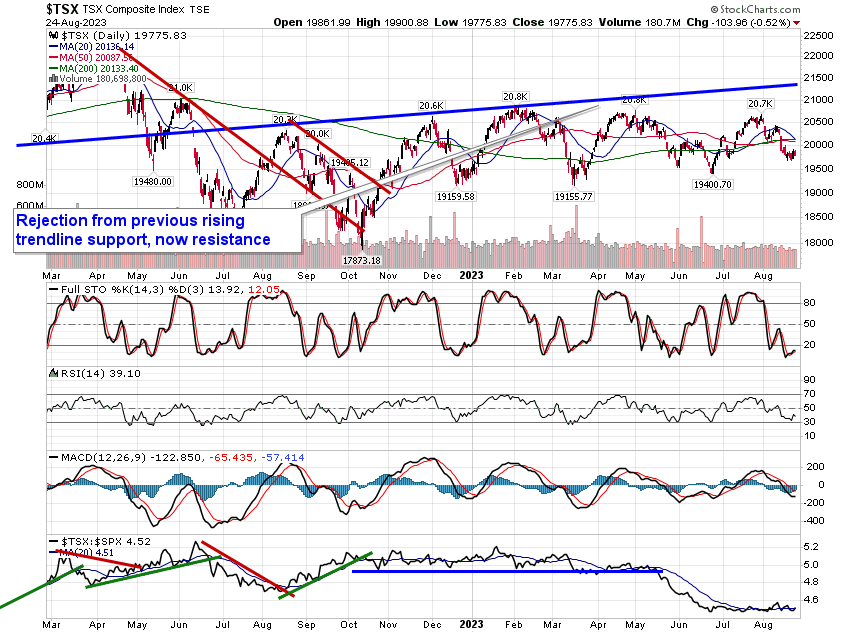
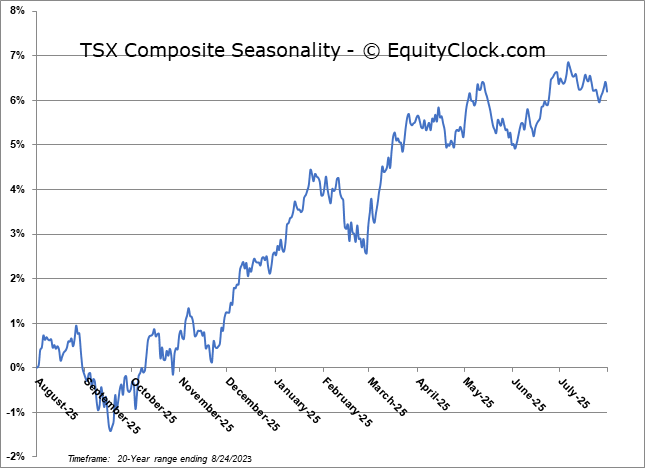
TSE Composite